T-Chart: Printable Template & How-To Guide

Download
Add to Folder
creative writing
children's book
activities
classroom tools
language arts and writing
vocabulary
Create new folder
CREATE NEW FOLDER
Share

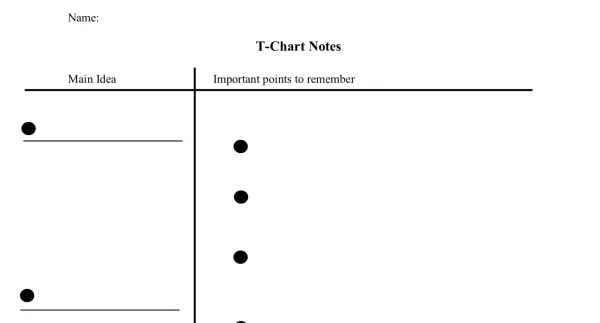
Download our printable T-chart template to help your students organize their notes

The T-Chart is a graphic organizer to help students keep their ideas organized. It teaches them to put their main idea on the left and details on the right. It also gives them a visual target number of three details to collect about each main idea.

In this introductory guide to the T-chart, we will explain how and when to use a T-chart, as well as different types of T-charts to be used in different scenarios

Grade:
5 |
6 |
7 |
8 |
9 |
10 |
11 |
+ show tags
Teaching Strategies:

What is a T-chart?

A T-chart is a type of graphic organizer that is used to visually organize information into two columns. The "T" shape created by the two columns allows for the comparison of two different aspects of a single topic or the comparison of two separate topics.

This tool is especially useful in teaching and learning environments, as it aids in understanding, analyzing, and recalling important information. It can be used for a variety of purposes, such as comparing and contrasting ideas, tracking events or behaviors, analyzing a text, or organizing thoughts for writing assignments.

Students take notes using T-chart graphic organizers.

Why use a T-chart?

The T-chart is a particularly effective tool compared to other graphic organizers due to its simplicity and versatility.

The clear, two-column structure of this graphic organizer makes it easy to compare and contrast information, analyze cause and effect, or organize thoughts for writing. Furthermore, they are not restricted to any one subject or topic, making them applicable in a wide range of disciplines and contexts.

Types of T-charts

There are several types of T-charts used in different scenarios:

Comparison

This type of T-chart is used to compare and contrast two different subjects. Each subject is assigned to a column, and each row in the chart represents a different aspect that is being compared.

Cause and Effect

This T-chart is used to analyze cause-and-effect relationships. The left column is used for causes, while the right column is used for effects.

Fact and Opinion

This T-chart is used to separate facts from opinions. The left column lists facts, while the right column lists opinions.

Pros and Cons

This T-chart is used for decision-making or evaluating the advantages and disadvantages of a situation. The left column is used for pros, while the right column is used for cons.

Character Analysis

In literature or character analysis, a T-chart can be used to list traits or characteristics of a character on one side, and evidence supporting those traits on the other.

Sequence of Events

This type of T-chart is used to track events or behaviors over time. The left column is used to list the times or sequences, while the right column is used to list the events or behaviors.

How to Make a T-chart

Making a T-chart is a straightforward process that requires just a few steps:

1. Draw a large "T" on your page

The vertical line of the T divides the page into two columns, while the horizontal line serves as the heading area for each column.

2. Label each column

Depending on the purpose of your chart, you might label your columns with different categories or prompts. For example, if you're comparing two things, you might label each column with the names of the things you're comparing.

3. Fill in the rows with corresponding details

Under each column's heading, write the details that correspond to each category. Ensure that each row aligns across both columns for easy comparison or correlation.

4. Review and analyze the information

Once you've filled in your chart, review the information and analyze it based on your objectives. This could involve comparing and contrasting the entries, looking for patterns, or drawing conclusions.

Remember, the key to a successful T-chart is clarity. Make sure your labels are clear, your entries are concise, and your handwriting is legible.

About the author

Haley Horton

Digital Content Manager & Editor

About Haley

A native of Boston, Massachusetts, Haley now resides in England where she obtained her Bachelor's and Master's degrees in Literature. She is an experienced writer and editor… Read more

loading gif