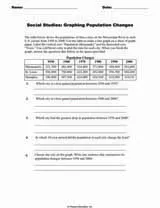
In this activity, students use a table to make a line graph and answer various questions based on the population changes of three cities on the Mississippi River.
Featured Middle School Resources
ASSESSMENT
Exit Tickets for Middle School Classrooms
Exit tickets are a form of assessment that are often used informally to assess how well students grasped a lesson, what ...
ACTIVITIES
Test Prep Strategies, Tools, and Practice Questions
Help set your students up for academic success with this packet of test-taking tips, test preparation strategies, and pr...
CHOICE BOARDS
Geography Activities for Middle School
Help students explore the world and develop their geography knowledge with this packet of geography activities for middl...
Related Resources
CLASSROOM TOOLS
Report Card Comments & Phrases—Social Studies
Social Studies Report Card Comments & Phrases
Positive social studies comments
_______ demonstrates a solid...
Mathematics: Graphing Population Data
In this activity, students are given a table and asked to make a line graph comparing the populations of countries.
Social Studies: Babe Didrikson
In this activity, students are asked to read a passage about Babe Didrikson and answer several questions relating to the...
Social Studies: Making a Model Shaduf
In this activity, students are given instructions and asked to make a model of a shaduf.
Social Studies: Squanto
Students are asked to read several paragraphs about Squanto.
Social Studies: The Maya
Students are asked to read a brief history about the Mayans.