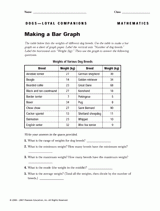
This worksheet includes several FutureFit Extension Activities that highlight 21st Century skills like critical thinking and problem-solving. These FutureFit Extension Activities are designed to reinforce the concepts included in the worksheet activity while integrating real-world skills. They can also be used as in-class independent practice or group activities, or assigned for take-home as independent work.
FutureFit Extension Activities
Investigate
Give students five minutes to copy the data from the five different dog breeds from the worksheet into a Google Sheet or Excel spreadsheet that contains a 3rd column labeled “Life Expectancy.” Then allow students five minutes or so to use computers or tablets to research the average life expectancy of the five breeds they chose and enter the data into the Life Expectancy column. Finally, ask them to complete another version of the bar graph that includes the new data set.
Solve
Using the data on life expectancy gathered in the previous exercise, ask students to create a graph that correlates the weight of each dog breed with its life expectancy. Ask students to write a brief summary of any correlative patterns they may find in the data (i.e., heavier dogs live shorter lives, lighter dogs live longer lives, etc.)


