The penny, which has been around in the United States in one form or another since 1787, was the first currency of any type authorized by the newly formed America. Benjamin Franklin, who is well known for his famous quotation regarding the penny ("A penny saved is a penny earned"), suggested the first design for the new coin.
The original penny was 100 percent copper and was known as the Fugio cent. It was made at a privately owned mint. That particular model of penny lasted until 1859, when the Indian Cent was introduced. If you've never seen an Indian penny, be sure to check your change. They still show up now and then, and they're very cool. The Lincoln penny-our current model-first appeared in 1909 to mark the 100-year anniversary of Abe's birth.
The Lincoln penny has undergone numerous design changes as well as changes in composition. During World War II the composition of the penny was changed from 95 percent copper and 5 percent zinc and tin to zinc-coated steel because copper was needed for war efforts.
The problem you'll try to solve in this section, however, doesn't concern the design of pennies or what they will buy. Instead, you'll explore the chemical composition of pennies minted during the past 30 or 35 years, trying to figure out if and when it has changed. Let's get started.
So What Seems to Be the Problem?
The problem, or question you'll attempt to answer during the course of this project, is whether the chemical composition of the penny has changed over the decades since 1970. In other words, are different materials used to make newer pennies than those that were used to make older pennies?
Pennies minted before 1970 look pretty much the same as those minted after. They're probably dirtier, but you can't tell by looking at them whether they're made of the same materials.
By the time you finish the project, however, you'll know whether the composition of those pennies you carry around in your purse or pockets has changed during the past 30 or 35 years.
If you want to give a name to your project, you could use the section title, "Are All Pennies Created Equal?" A few other suggestions for project titles are:
- How Have Our Pennies Changed?
- A Penny Is a Penny-or Is It?
- Exploring the Chemical Composition of a Penny
Now that you've identified the problem you'll be attempting to solve, it's time to consider the purpose of this project.
What's the Point?
The point of this project is to determine, using the scientific method, whether pennies made before 1970 (those will be your control group) are heavier or lighter than those made in each decade after that date (the groups of pennies from each decade since the 1970s will be your variable groups). You also should be able to get an idea of specific years in which the weight of the penny was changed.
So why are we suggesting this topic for a science fair project? Who really cares what materials are used to make one-cent coins, anyway? It doesn't change the way they look or what you can buy with them, right?
You can't tell by looking at pennies whether they're made of exactly the same materials. The older ones are the same size as the newer ones, so they look the same. The only way to establish whether the chemical composition of the different groups of pennies is the same or different is to determine the mass (weight) of each group.
Different metals have different densities. A penny containing more of a certain metal than another penny will have a different mass, because its density is different.
If the average mass of your control group (those pennies minted before 1970) is different from that of any of the variable groups, you'll know that the pennies are not made of the same amounts of the same materials.
What Do You Think Will Happen?
Take a few minutes to think about the facts stated below, and then try to work out your hypothesis.
- The mass of one cubic centimeter of copper is 8.96 grams, while the mass of the same amount of zinc is 7.13 grams.
- A penny is made of copper and zinc.
- Copper is heavier than zinc.
- The cost of copper has been on the rise during the past couple of decades.
- It's less expensive to mint a penny that contains an increased amount of zinc.
Once you've considered these facts, you should be able to make an educated guess concerning the results of your experiment. But you won't know for sure until the experiment is completed.
Materials You'll Need for This Project
There are very few materials needed for this experiment. The only things you'll need are listed below.
- An electronic or digital balance scale or other tool to measure mass.
- Enough pennies to produce 10 of each group. You'll need 10 pennies minted before 1970, 10 minted from 1970 through 1979, 10 minted between 1980 and 1989, 10 minted between 1990 and 1999, and 10 that have been minted since 2000.
A traditional balance scale is a scale that has two pans that hang from opposite ends of an overhead arm. If objects placed in the different pans are of different weights, the pan holding the heavier object will be lower than the pan containing the lighter object. There are many electronic versions of balance scales available. You can purchase one in your local office supply store.
If you happen to have a balance scale in your home or can borrow one, that's great. If you don't have one, ask your science teacher if the school has one you can use. If you can't take it home with you, you can easily carry your pennies along to school and weigh them there.
If you don't have a piggy bank you can break into and rob, you can easily get pennies from your local bank. A roll of pennies contains 50 coins, so you'll need to take a few dollars along to exchange for five or six rolls of pennies.
Ideally, you'll have a group of 10 pennies all minted before 1970, and one penny from each year between 1970 and 2000.
It's probably not a bad idea to get an extra roll or two, because you want to ensure that you'll have enough pennies from both the control group and the variable groups to be able to conduct your experiment.
Conducting Your Experiment
You've identified the problem you're attempting to solve, come up with a hypothesis, and gathered the materials you need; now you're ready to begin your experiment.
The experiment, as you know, is the heart of a science fair project, so be sure to work carefully and in an organized manner. Just follow these steps, and remember to carefully note your observations. It would be a good idea to fill in the charts illustrated in the next section, "Keeping Track of Your Experiment," as you proceed. You'll need to make a chart for each group of pennies to be able to record all your data. You'll end up with four charts.
Follow these steps:
- Look through the pennies you have and find 10 that were minted before 1970. Do not include those made in that year.
- List the date of each of the 10 pennies in chronological order on a data chart similar to the first one in the next section. Remember that the dates on this chart are just samples. You'll need to fill in the dates from the pennies you're using.
- Using your balance scale, determine the mass of each penny in grams to the hundredths place, starting with the oldest and working up to the newest.
- Calculate the average mass of one penny and record the mass on your data chart.
- Select 10 pennies from your pile that were minted between 1970 and 1979.
- Repeat steps 2 through 4, using those pennies.
- Gather 10 pennies minted between 1980 and 1989.
- Repeat steps 2 through 4, using those pennies.
- Collect from your pile 10 pennies made between 1990 and 1999.
- Repeat steps 2 through 4, using those pennies.
Once you've determined the average mass of each group of pennies, you'll be ready to begin analyzing your data.
Keeping Track of Your Experiment
To keep track of your findings, use these charts or similar ones you make yourself. Remember that you'll have four charts when you're finished.
| Date of Penny | Mass in Grams |
|---|---|
| 1. 1955 | ______ |
| 2. 1956 | ______ |
| 3. 1960 | ______ |
| 4. 1961 | ______ |
| 5. 1962 | ______ |
| 6. 1964 | ______ |
| 7. 1965 | ______ |
| 8. 1966 | ______ |
| 9. 1967 | ______ |
| 10. 1969 | ______ |
| average mass in grams: | ______ |
| Date of Penny | Mass in Grams |
| 1. 1970 | ______ |
| 2. 1971 | ______ |
| 3. 1972 | ______ |
| 4. 1973 | ______ |
| 5. 1974 | ______ |
| 6. 1975 | ______ |
| 7. 1976 | ______ |
| 8. 1977 | ______ |
| 9. 1978 | ______ |
| 10. 1979 | ______ |
| average mass in grams: | ______ |
| Date of Penny | Mass in Grams |
| 1. 1980 | ______ |
| 2. 1981 | ______ |
| 3. 1982 | ______ |
| 4. 1983 | ______ |
| 5. 1984 | ______ |
| 6. 1985 | ______ |
| 7. 1986 | ______ |
| 8. 1987 | ______ |
| 9. 1988 | ______ |
| 10. 1989 | ______ |
| average mass in grams: | ______ |
| Date of Penny | Mass in Grams |
| 1. 1990 | ______ |
| 2. 1991 | ______ |
| 3. 1992 | ______ |
| 4. 1993 | ______ |
| 5. 1994 | ______ |
| 6. 1995 | ______ |
| 7. 1996 | ______ |
| 8. 1997 | ______ |
| 9. 1998 | ______ |
| 10. 1999 | ______ |
| average mass in grams: | ______ |
When you've finished your experiment and have each of the four data charts filled out, you'll need to look at each chart and begin making some comparisons.
Putting It All Together
The cost of copper increased dramatically during the 1980s, forcing the government to change the proportion of copper to zinc found in pennies.
The bottom line, of course, is whether the pennies minted pre-1970 are heavier than those in any other group. If they are, what conclusions can you draw? Remember those facts presented a few pages back in the section about reaching a hypothesis? Think about those facts-they'll help you to draw some interesting conclusions.
Also note any other interesting observations. For example:
- Did the weight of the pennies decrease steadily from one decade to the next?
- Is there one decade, or perhaps even one year, in which the mass changed significantly?
- Are the newest pennies the lightest ones?
- What's the difference of the average mass in grams between the heaviest group and the lightest group?
- Are there any kinds of patterns or disruptions to patterns?
Make all the observations you can, and use them to help you formulate a conclusion.
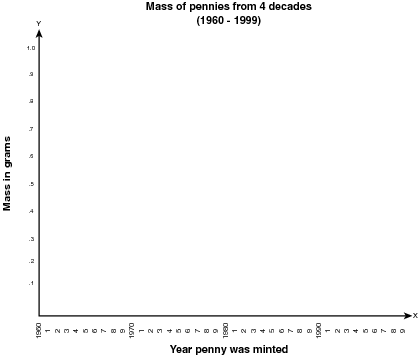
You could represent the data on your charts on a line graph. On the horizontal line (called the X axis), you would write the year of each penny you weighed, beginning with the earliest year.
On the vertical line (called the Y axis), you would list the range of masses from lightest to heaviest.
Once you've graphed your information and studied your conclusions, you can come up with a decisive statement concerning the chemical composition of the penny. Are pennies made after 1970 and throughout the following decades lighter than those made prior to that year? Was your hypothesis correct?
Further Investigation
As suggested earlier in this section, if you've determined that the weight of pennies has, indeed, been changing over the decades, maybe you'll want to take a closer look and try to figure out why.
The obvious answer seems to be that pennies are lighter than they used to be because they contain less copper and more zinc in an effort to offset the rising cost of copper. But, according to figures from AME Mineral Economics, a global firm of independent economists in the metal and mineral industries, the cost of copper actually declined in 2001. Does this mean the government might start replacing the zinc found in pennies with copper?
Another way to go a step further on this project is to repeat the experiment using 10 pennies from each year of the particular decade in which you noticed a significant change in the average mass of the pennies, compared to the control group. You would, for instance, determine the mass of 10 pennies dated every year between 1980 and 1990, meaning that you'll need 100 pennies.
By doing so, you'd be able to tell if the mass decreased steadily each year, or if it was steady for several years and then took a big drop. You may notice some interesting patterns and be able to pinpoint a particular year in which the chemical composition changed significantly.
A penny saved is a...penny that's no longer a penny?!
Teach your students about the chemical compounds within a penny with this hands-on science activity. Students study pennies minted in the last 35 years to determine if their chemical compounds have changed.