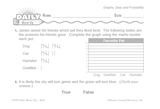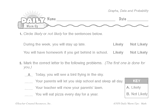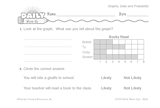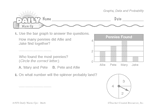
Animated Math Video: Organize Data into Three Categories Grade 1
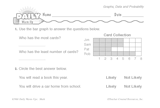
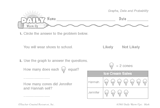
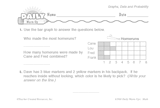
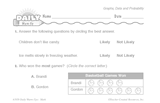
In this video, Marta, Alex, Jackson, Daniel and Jada learn how to collect and organize survey data using a simple tally chart.
Grade:
Subjects:
Mathematics
Probability and Statistics