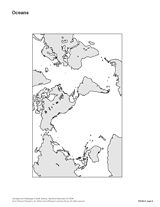
Enhance your social studies and earth science curriculum with colorful geography transparencies and visuals in this slideshow. Use these printable maps to illustrate geographic differences, time zones, and boundaries. Students will compare soil composition, locate mountain belts, identify oceans, visualize climate zones, and more with these resources.
Subjects:
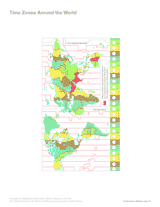
Use this printable map to compare time differences and visualize the boundaries of time zones around the world. The Canadian engineer and inventor Sir Sandford Fleming first suggested Universal Standard Time in the late 1800s.
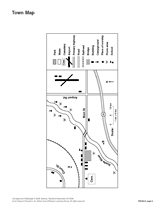
Sharpen students' map reading skills with this handout. Ask students to use the key to identify items on the town map.
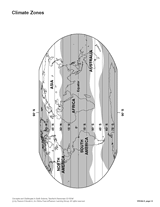
Use this map to help students visualize climate zones around the world.
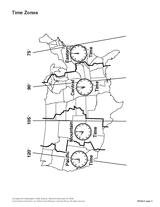
This map will help students visualize time zones in the United States.