How Can You Stretch Students' Thinking?
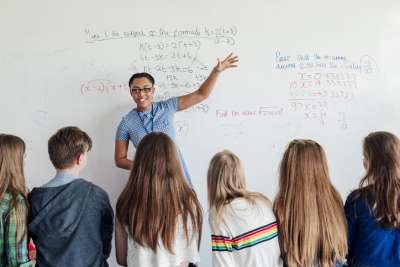
To challenge students' thinking, model word problems that have multiple answers, and discuss algebraic expressions one could use to solve them. Have students use formulas in a spreadsheet to build simple mathematical models of word problems.
Another way to stretch student's thinking is to make data tables that represent the results of functions, and then have students create graphs from the data. Students can then interpret the graphs, asking questions and analyzing the changes and constants that are represented graphically.
When Can You Use It?
Reading/English
Have students compare the readability of texts and plot the reading difficulty on a chart, creating a scatterplot. Students will find variables, such as the average number of sentences and syllables per word, creating functions to find the readability of texts.
Writing
Once students have constructed algebraic models, have them provide written descriptions of how they developed the model and how it works, illustrated with appropriate graphs, tables, and mathematical expressions.
Math
One of the best ways to engage students is to have them collect data, identify patterns, create mathematical models, and then test those models by considering the data they generate.
Social Studies
Have students collect statistical data (e.g., population growth, crime statistics, agricultural statistics, or sports statistics), display the data in multiple forms (e.g., graphs and tables), and then create mathematical models that approximate the relationships across values. For example, have students look at total population growth in their state over time compared to the population growth of the United States as a whole. Then ask them if the relationship be expressed by a formula.
Science
Students can graph information from an experiment. For example, have students graph the air temperature in their state on the first day of each month of the year. Have them interpret the graph and discuss why the temperature changes throughout the year. Ask them to hypothesize about why the temperature changes more rapidly during certain months than others. Do the same for different regions around the world and compare the results. Can students develop a formula or function machine that "guesses" the temperature, if given the month of the year?
Have students use scales to experiment with balance and equality. Have them explore the weight of various objects and create equations based on their results. For example, "The weight of one stapler is equal to the weight of two cups, one book, and eight pencils." Then have students use variables to record their equations and describe their equations in writing.


